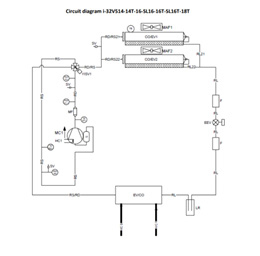
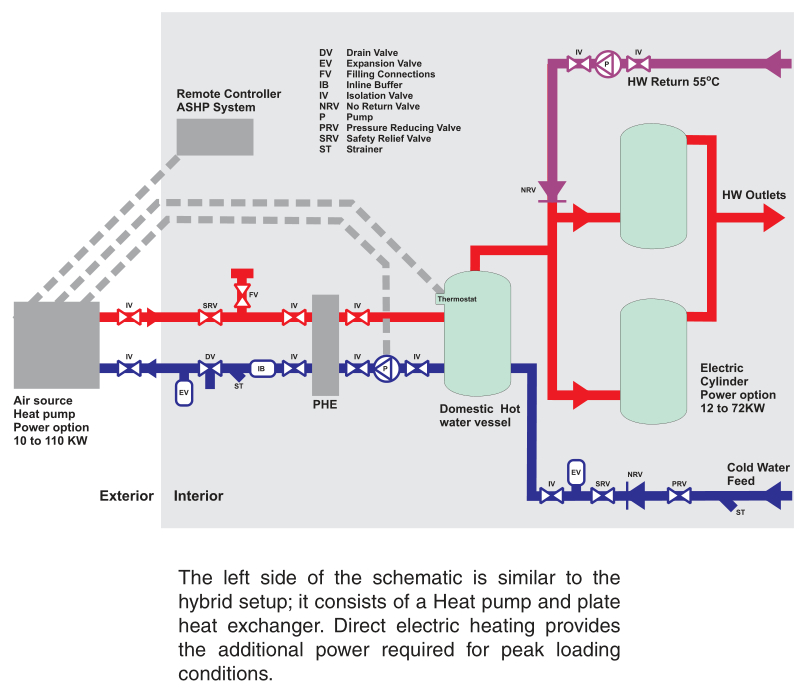
This CPD will show the savings achieved using three low-carbon systems. The first system is a gas combustion continuous flow water heater that can run on hydrogen blends up to 20 %, as shown in figure 2. The second system is defined as a hybrid and consists of a heat pump and gas water heater 20% hydrogen blend ready, as shown in figure 3. The third system is the all-electric and consists of a heat pump and direct electric cylinder, as shown in figure 4. The study uses “notions” of buildings from previous real-life projects to compare each system. The notion establishes the building’s peak loading conditions, temperature, and recovery times. In this article, a gym health centre is used as a notion. The comparison focuses on detailed schematics, carbon emissions and capital & operation costs of each system. Low Carbon technology The primary technology used in the three systems are: Heat pumps, considered low carbon technology because they use electricity to move heat from one location to another. The fundamental idea is to move heat from one place to another using a refrigerant fluid. The refrigerant evaporates at one location, absorbing heat, then condenses at the location where the heat is delivered. Figure 1 shows the working schematic of the air-to-water heat pump. The 4-way valve can reverse the cycle and switch to cooling mode. The air-to-water heat pump was a key technology in the Heat and Building Strategy (1).
Figure 1; heat pump working principle.
Direct electric heating has no emission at the point of use. However, this type of system plays a minor role in the Heating and Building Strategy because it puts a lot of pressure on the electric infrastructure (2) (3). Hydrogen could replace natural gas over the coming years. Critical decisions on the role of hydrogen in heating are coming in the next 2-3 years (2). Hydrogen has a solid potential to become a zero-carbon energy source because it does not produce carbon at the point of use. Green hydrogen is still considered expensive, but current developments are decreasing the costs (4) (5). To facilitate the transition and development of the gas network, the UK government will continue to work with the Health and Safety Executive to enable up to 20 % hydrogen blending on the network by 2024, subject to the success of testing and trials.
Type 2 buildings- Gym health centre
This notion has 12 showers, and 4 wash hand sinks. The three low-carbon systems were sized accordingly to the specific requirement of the notion. The cost of the heat pump was also considered during the selection process. Three designs were generated as follows.
- Combustion – 3 x instantaneous water heater 56kW, as shown in figure 2
- Hybrid – 28 kW heat pump and 3 x instantaneous water heater 56kW, as shown in figure 3
- Fully Electric– 28 heat pump kW and 2 x 48 kW direct electric heater, as shown in figure 4.
Figure 2: Combustion System
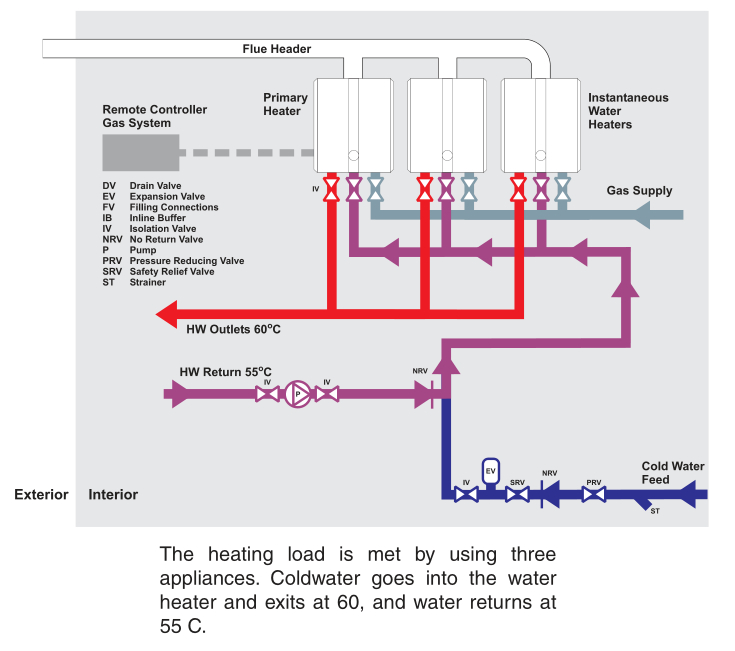
Figure 3: Hybrid System
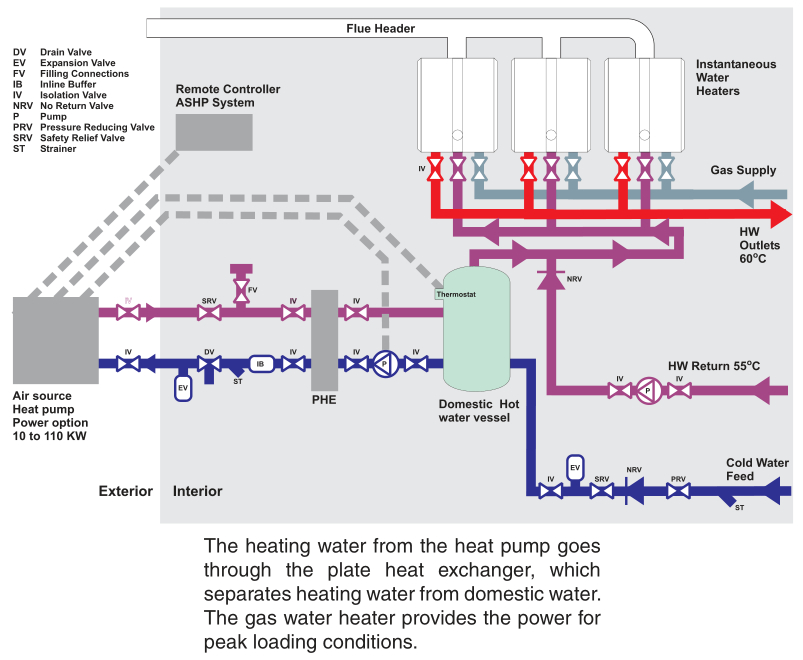
Figure 4: All Electric system
Carbon & Cost Comparison
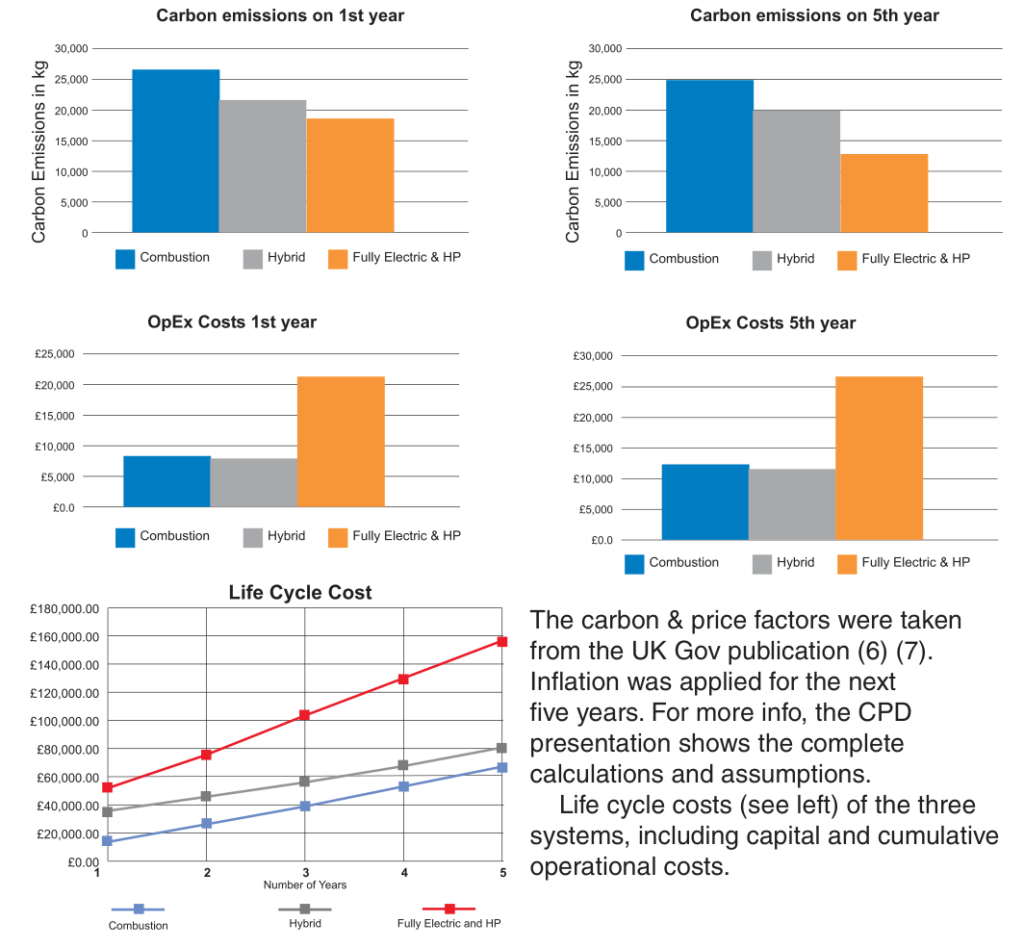
The carbon & price factors were taken from the UK Gov publication (6) (7). Inflation was applied for the next five years. For more info, the CPD presentation shows the complete calculations and assumptions. Life cycle costs (see left) of the three systems, including capital and cumulative operational costs.
The electric system is still the most expensive system to run. Heat pumps can decrease the running cost but have a massive impact on capital costs. The life cycle chart shows the capital and the cumulative operational costs. This graph evaluates the total investment of each system. The combustion system is the cheapest option in a life cycle of 5 years, as shown above. The hybrid system was considered the best option for running costs; hybrid is also an excellent compromise to achieve carbon savings when mindful of costs and operational performance. The electric option produces less carbon, with more savings coming in the next five years thanks to the planned grid improvement. The gas network might also become greener through a mix of hydrogen and biomethane; however, long-term development is not included in 5 years, and only a 20 % hydrogen blend was considered from 2025. It is important when considering these options that economic, practical and technological considerations are made and that multiple de-carbonisation pathways are evaluated relative to system performance needs.
References
- Department for Business, Energy & Industrial Strategy, Heat and buildings strategy, October 2021. https://www.gov.uk/government/publications/heat-and-buildings-strategy
- Department for Business, Energy & Industrial Strategy, August 2021, UK hydrogen Strategy. https://www.gov.uk/government/publications/uk-hydrogen-strategy
- Department for Levelling Up, Housing and Communities and Ministry of Housing, Communities & Local Government, Consultation outcome, The Future Buildings Standard, Dec 2021
- Sojoudi, A., Sefidan, A. M., & Alam, K. (2021). Chapter 7 – Hydrogen production via electrolysis: Mathematical modeling approach. Retrieved from Science Direct: https://doi.org/10.1016/B978-0-12-822525-7.00012-3
- Kayfeci, M., Kecebas, A., & Bayat, M. (2019). Solar Hydrogen Production. Retrieved from Science Direct: https://doi.org/10.1016/B978-0-12-814853-2.00003-5
- Department for Business, Energy & Industrial Strategy, June 2022, Prices of fuels purchased by non-domestic consumers in the United Kingdom excluding/including CCL.
- Department for Business, Energy & Industrial Strategy, Jan 2022, Conversion factors 2021: condensed set (for most users) – revised January 2022